Viewing The Trends Graph In Online Examination System
Shown below are the
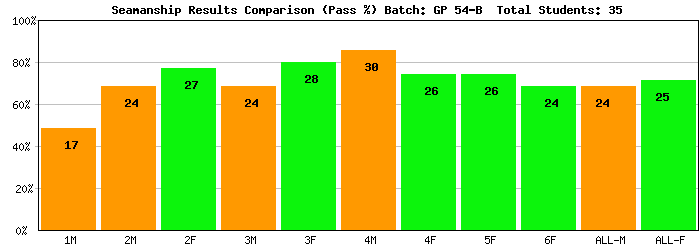
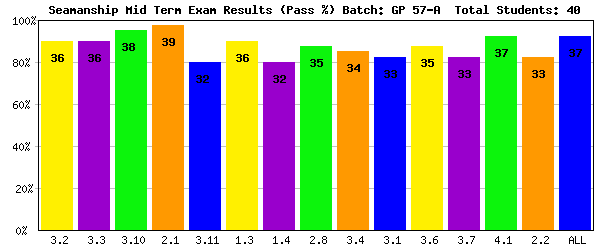
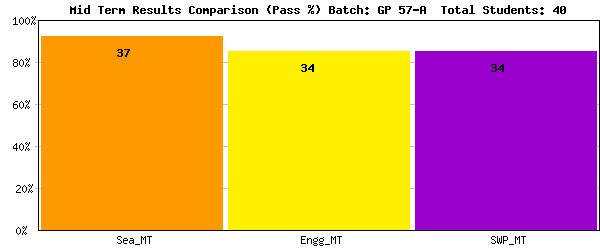
Trends Graphs of the Customized Online Examination System developed in MySQL and PHP
for a leading Maritime Academy located in Goa, India. The trends graph show the graph of how many students have passed in each topic of a
particular subject (Topic wise comparison graph) as well as how many students have passed in each subject (Subject wise comparison graph).
To view the graphical trends of the Online Examination System we have to click on View Trends on the menu
to the left. We can then select the required graph by clicking on the link provided . We will
then be presented with a page where we have to specify the Batch No for which we want to view
the graph. On submitting the Batch Number we can view the view the desired graph.
Topicwise Pass Percentage
Subjectwise Pass Percentage
Topic Wise Pass Percentage (Comparison)